|
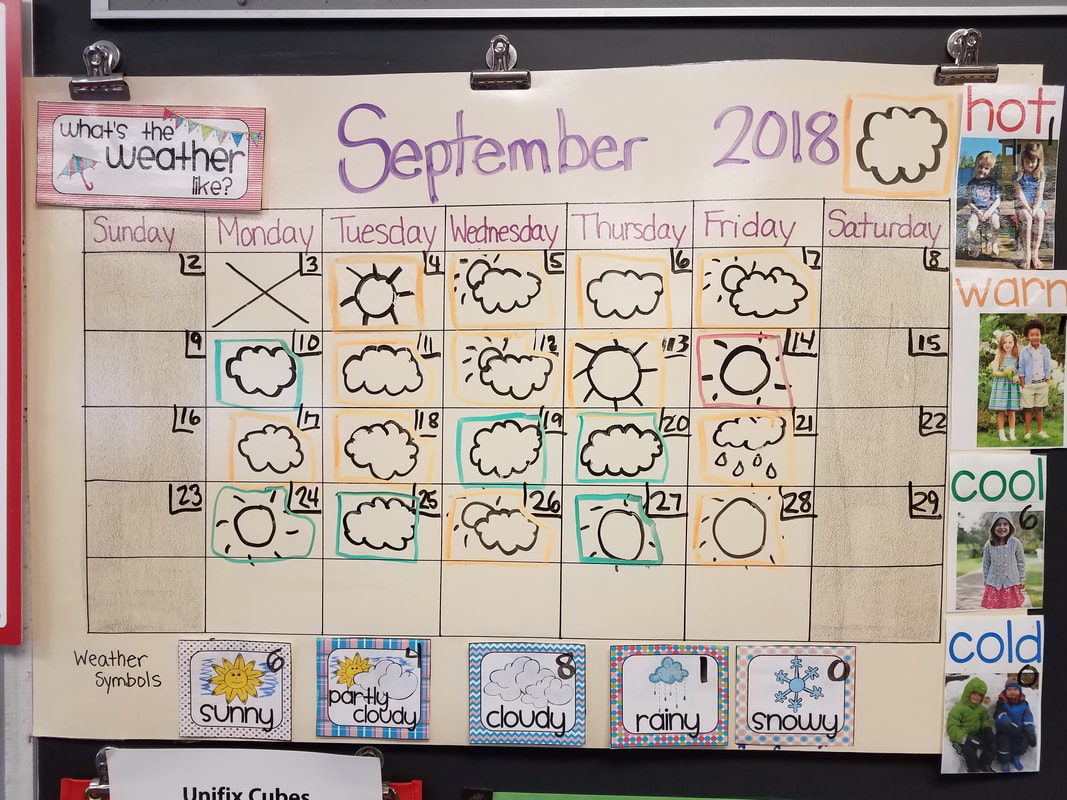
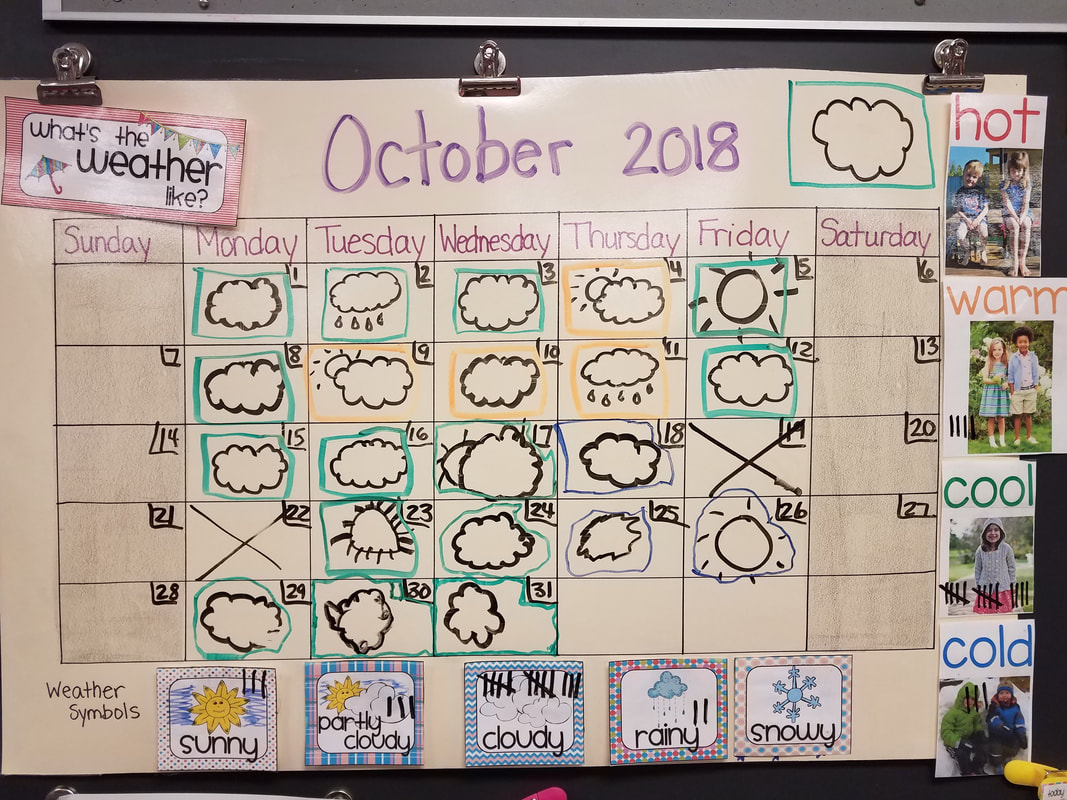
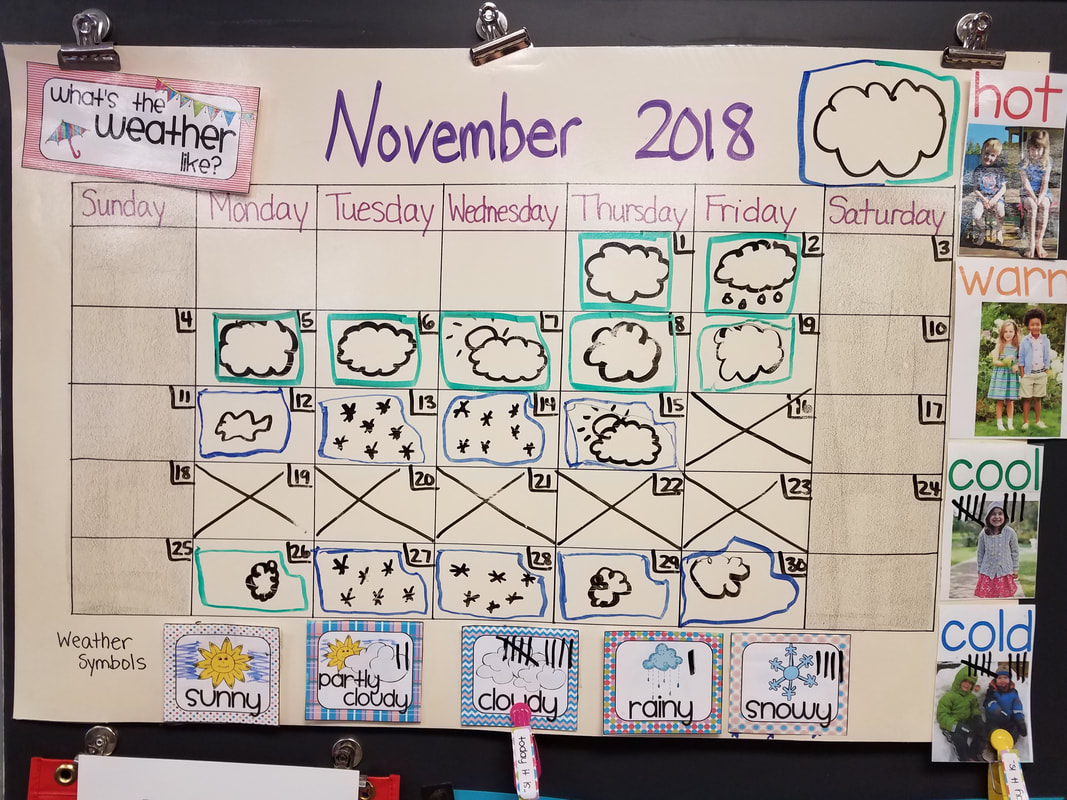
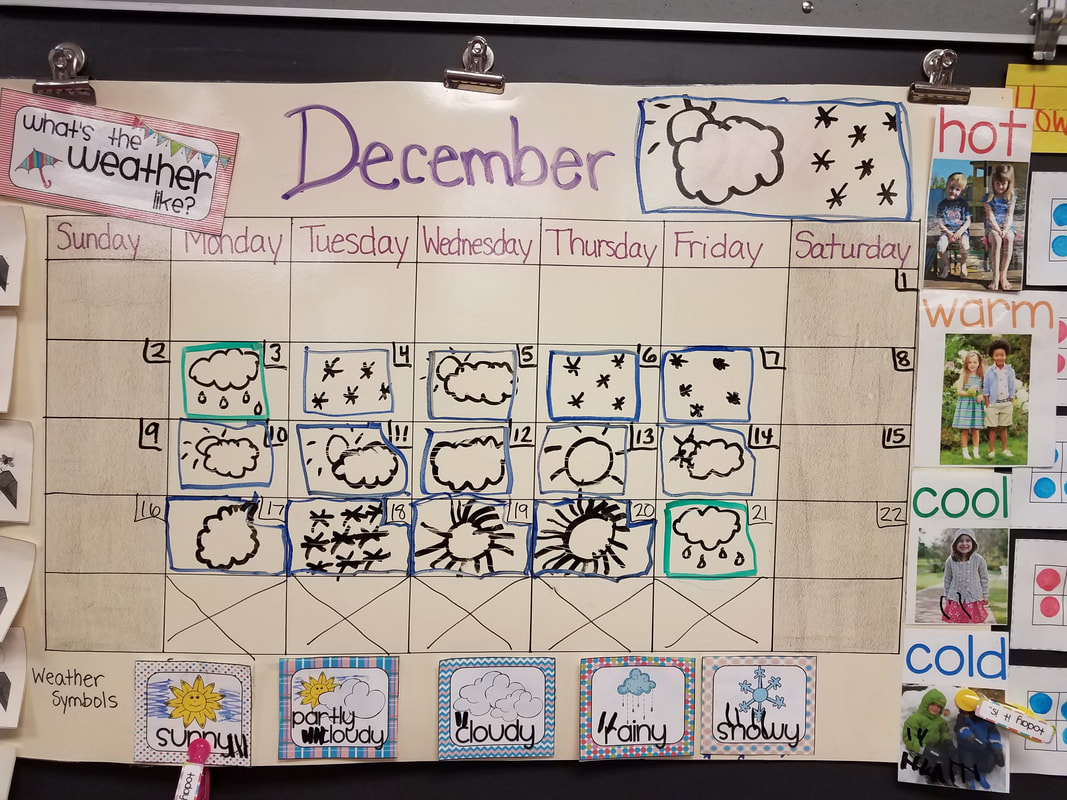
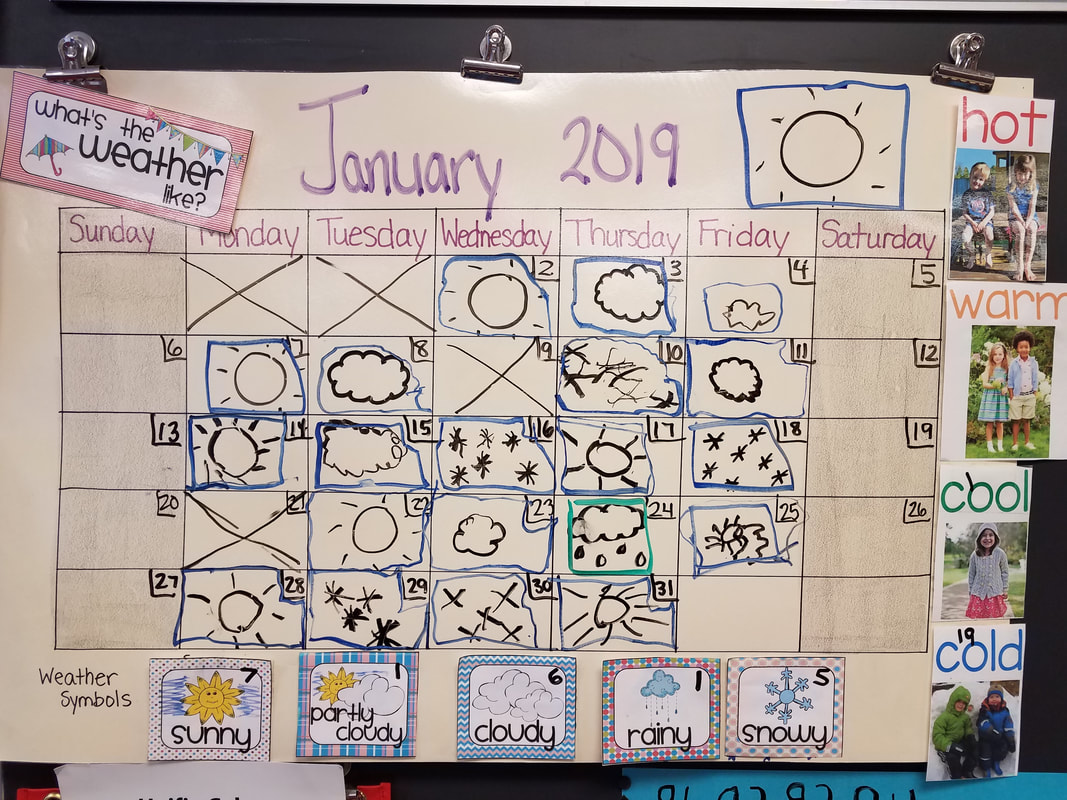
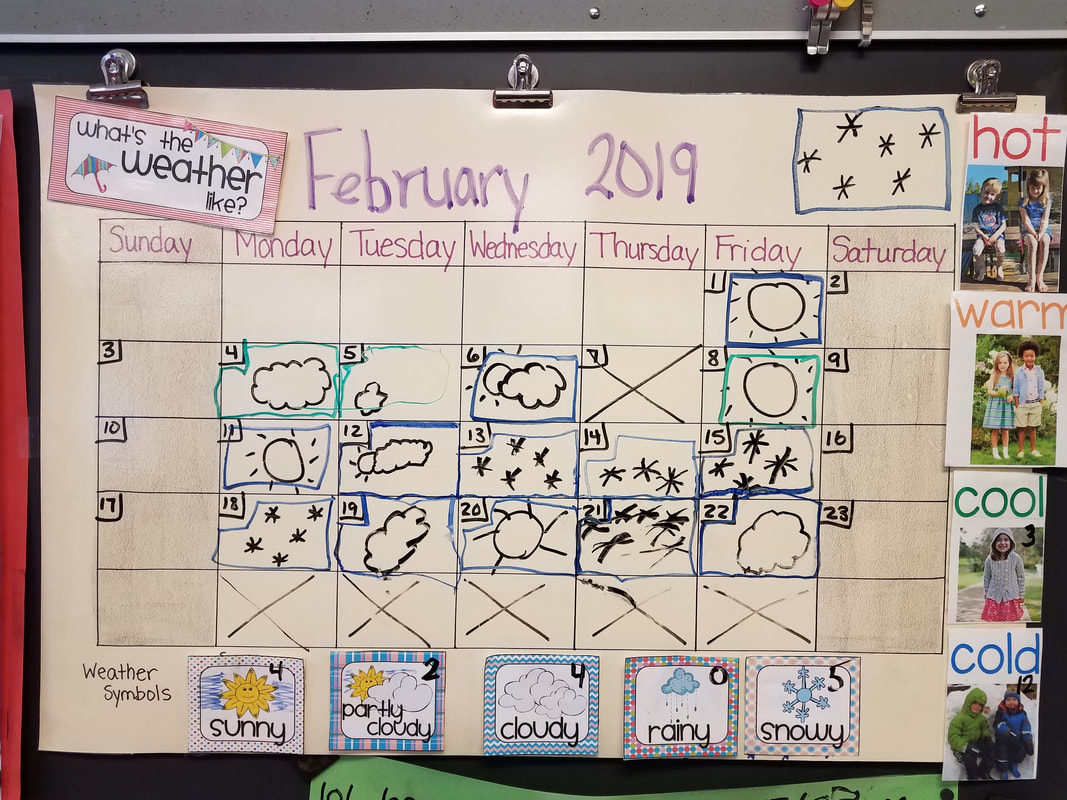
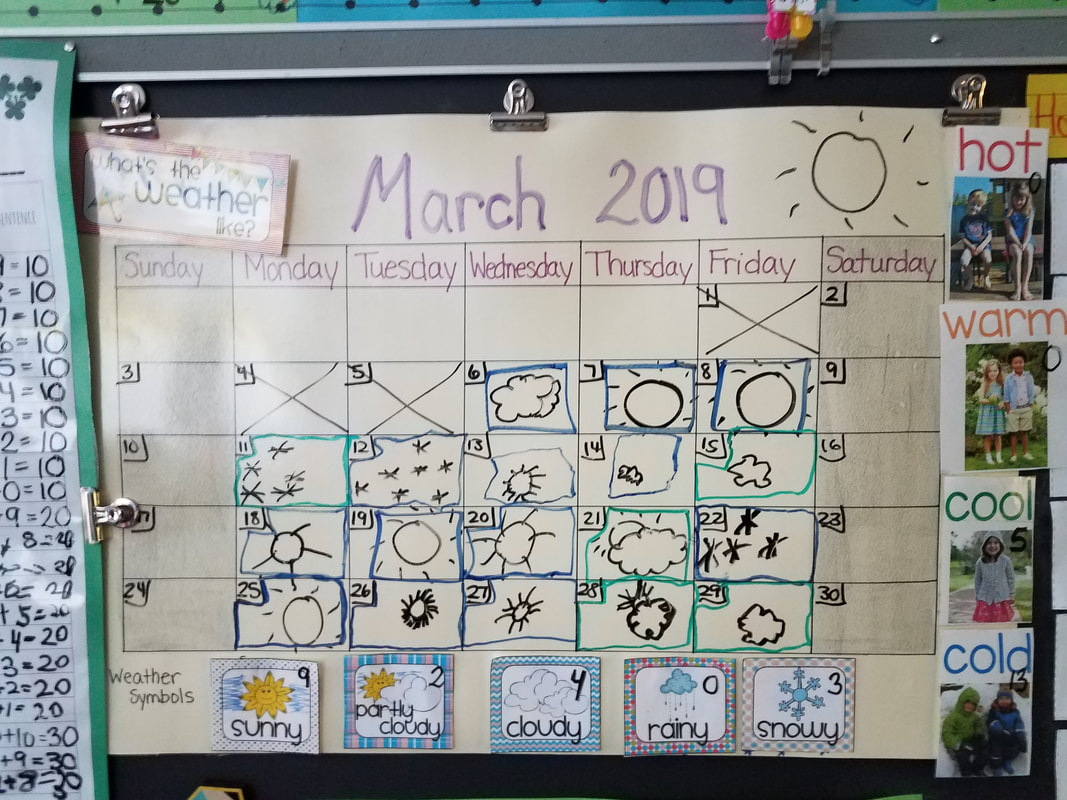
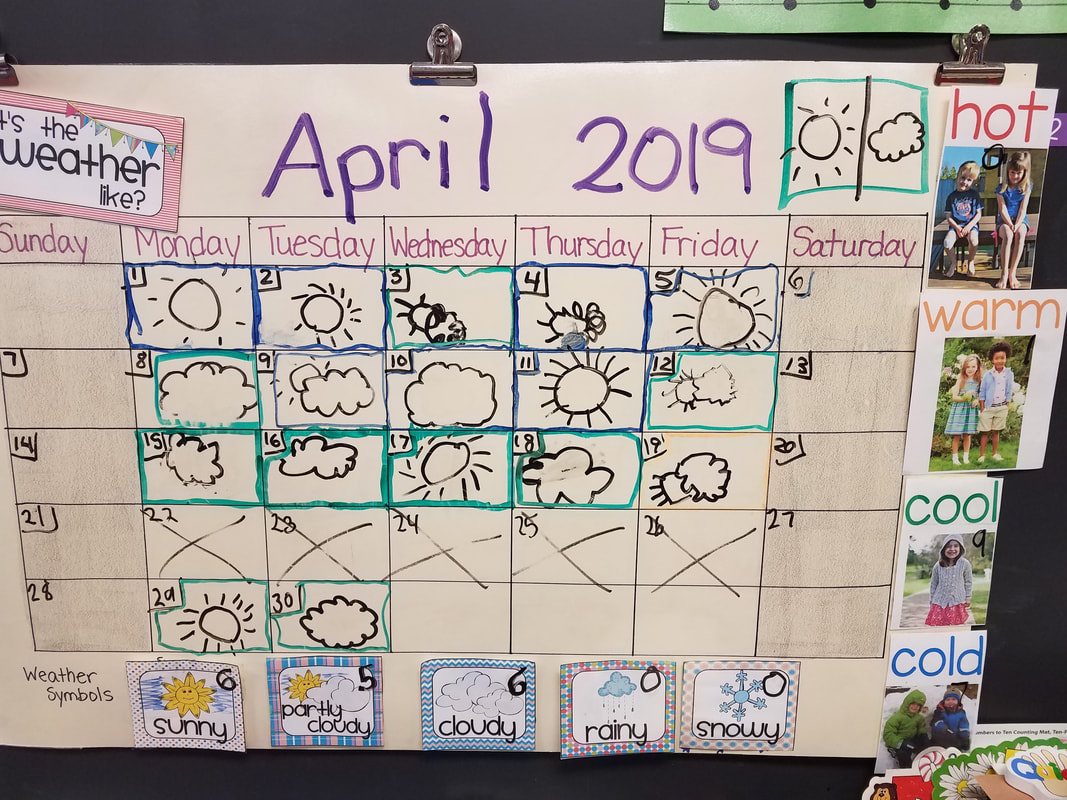
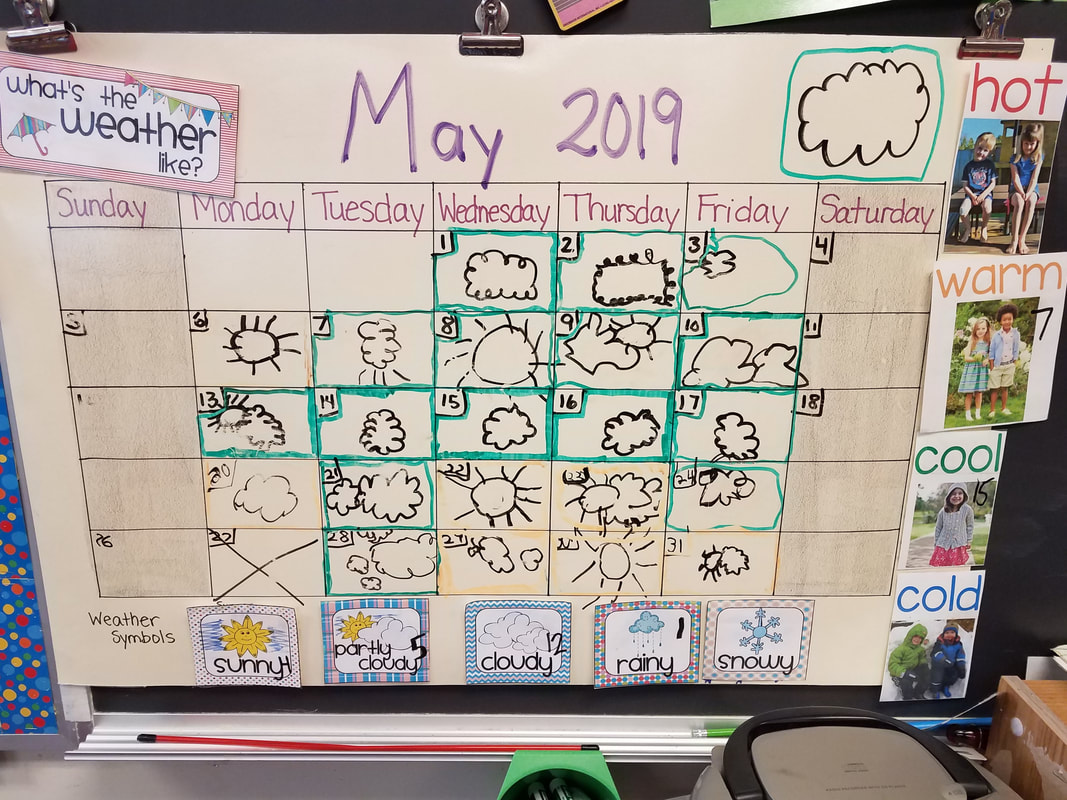
We've been busy in kindergarten this year...especially these last few weeks as we've finished up some great learning together and wrapping up all our final projects! All year long we did weather observations each month to determine what each month had an average weather like, and took all our data from the school year to create a video of weather reporters reporting out on information we collected. It was the students' (and my) first time using a green screen...and I think we did a pretty great job! I'm so proud of the results and while our weather was sometimes a bit weird this year (May was mostly cool, which is unusual), we talked about how Vermont weather can be unpredictable for sure. Below you'll see each months photograph of our weather (where we coded each day as the type of weather and the temperature it felt like), and then our final green screen weather reports! Each calendar photograph has the average, "mostly" weather in the top, right corner. For the video...click the button below and it'll take you to our "We Video" website. They begin with September, just as our data collection began, and go from there. Enjoy! |
 RSS Feed
